User Guide
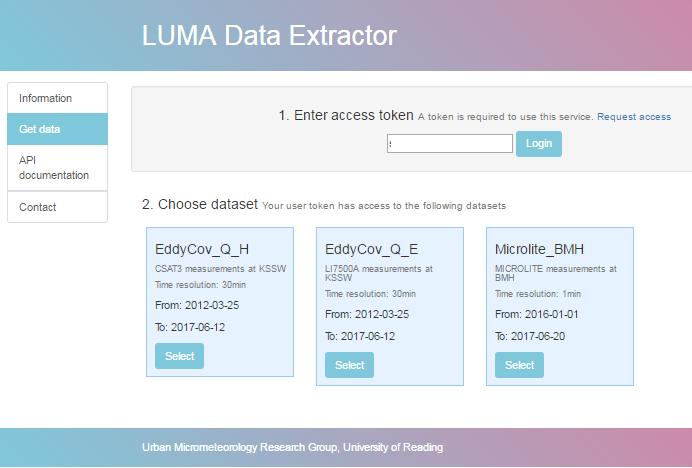
The LUMA data extractor requires a user token. Once you receive a token it must not be shared with anybody else.
Viewing available datasets
An account is associated with one or more datasets based on what has been granted by an administrator. A dataset is a subset of the LUMA archive specific to a particular combination of:
- Instrument model (e.g. Davis weather station)
- Measurement site
- Time resolution
- QAQC level
- In some cases, a specific variable (alternatively, all variables from that instrument may be provided)
To extract data from a dataset, or to see more information about it, click the “Select” button.
This populates the page with
further information about the instrument(s) and variable(s) available in the dataset:
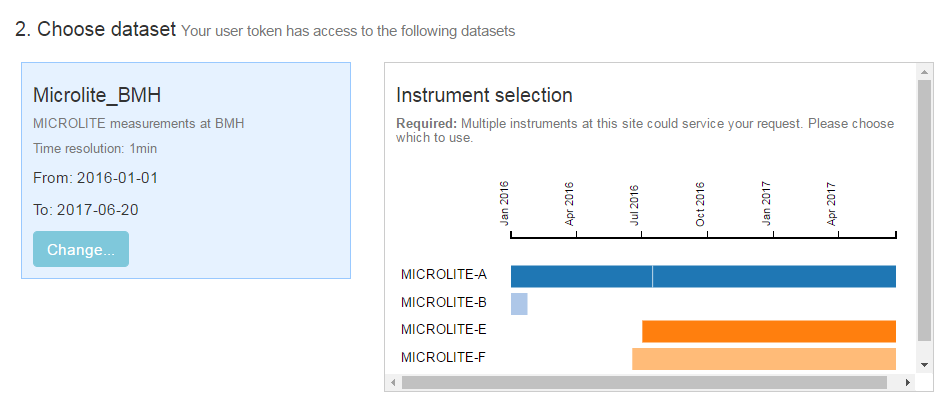
Instrument suffixes
Sometimes more than one instrument of the specified model is present at a site. For example, multiple Davis stations may be run in tandem, or one may replace the other after a period of time. A choice therefore has to be made about which one to use for the data download.
A suffix is associated with each physical instrument in the LUMA system. This suffix follows the instrument wherever it goes, analogous to a serial number. The suffixes involved in a measurement are shown as a timeline when a dataset is selected.
Choosing which suffix to use
If there are two instruments available at the same time, the administrator may recommend which suffix to use.
In this case, a download that covers the whole measurement period will prioritise the recommended instrument and use the
other one when this is not operating.
This is overridden by choosing a suffix from the drop-down box, or by clicking
its timeline in the Instrument selection box.
In this case, only data from the instrument with the chosen suffix is used, and data from the other
instrument must be downloaded separately.
If more than two instruments are present, a suffix must be chosen before the download can proceed.
Extraction options
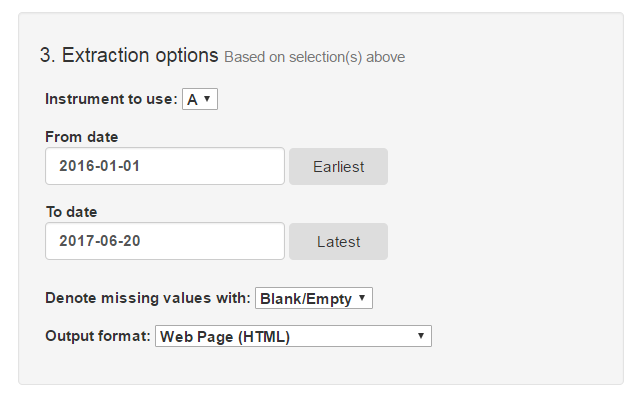
The time window of data to extract is specified using the dates below. These are set initially to the start and end date of measurements by the chosen instrument suffix (if applicable), but any date can be entered provided access was granted.
Your user account may only be allowed to download a certain number of records per request. If you request a period with more records than this, the downloaded data will end before it reaches the end date. In this case, a second request needs to be made.
Output format
The downloader outputs data in three formats:
- HTML (suitable for small samples only): A table of values is shown in the browser window
- CSV file: A comma-separated variable file is downloaded
- JSON: Data are provided in JSON format
Press “Get Data” to begin the download. This will launch in a new window. The data is streamed directly to your browser in a new window, and it may appear that the server is not responding to larger requests (multiple months to years), but data should appear in bulk after a few minutes having transferred in the background.
Missing values
If an instrument should be running but there is a gap in the data, gaps are filled with either:
- “-999.9”
- “x”
- A blank entry
Extracting data
A list of variables to be extracted is shown in the next box. 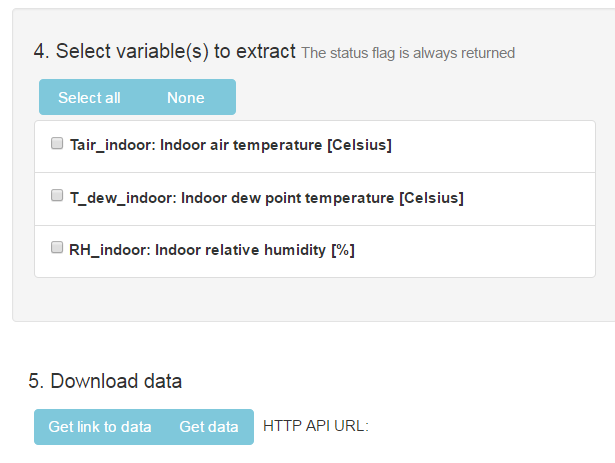
Regardless of the variable(s) chosen, the status flag is always returned with the data. The list contains the variable ID, the long name and its units of measurement.
After choosing which variable(s) to include, there are two options:
- Get link to data: The “HTTP API URL” entry to the right is then populated with a link that can be copied. Note that the link contains your user token and must therefore not be shared.
- Get data: Opens a new window that follows the link to data and begins the download.
CSV data is usually downloaded to a file, while HTML And JSON data normally appear in the browser window and must be saved separately. Alternatively, the data can be downloaded from the command line using the HTTP API URL generated in option 1: The following statement on a Linux/UNIX command line downloads the data directly:
curl –o output_file.json <URL>
Extractor output
An example of the HTML output from the extractor is show below:
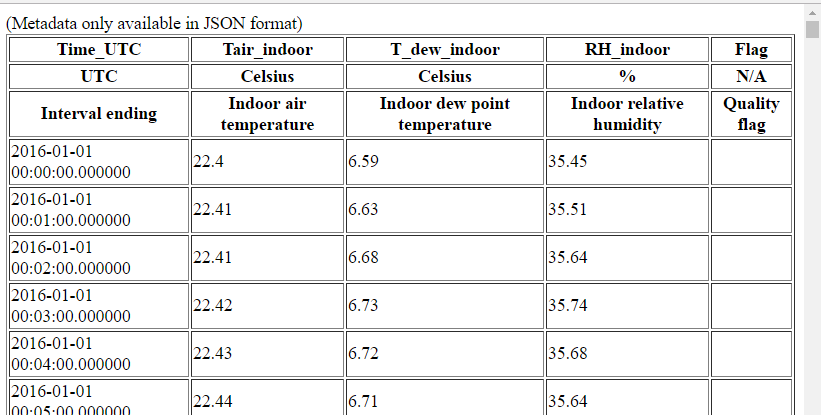
The table headings are the same in each output format:
- Variable ID
- Variable description
- Variable units
Tips
- If requesting a long date range (e.g. multiple months or years), the server may appear to be unresponsive for several minutes. This is caused by certain internet browsers loading the data in the background before displaying it.
- A day with no data whatsoever will be omitted from the data returned.
- A day with partly missing data will be flagged as a missing value in the returned data.
- When a profile measurement (one made over multiple heights) is extracted, there will be a copy of each variable for each height. These are arranged from low to high and correspond to the positions described in the metadata.
Metadata description
Metadata describing the measurements is always included if JSON data is downloaded. If data is downloaded in HTML or CSV format, metadata must be viewed separately using the "Display metadata" button before data can be downloaded. The metadata displayed applies only to the time period chosen in "Extraction options".
This section describes the metadata records. A complete metadata record is generated for every extraction, although not all fields are relevant to all sensors. In these cases the content of the field is “null”.
- siteInfo: Information describing the measurement site
- Site_city: City
- Site_lon_WGS84: WGS84 longitude (Degrees E)
- Site_network: WGS84 latitude (Degrees N)
- Site_lat_WGS84: Network (or project) that site is associated with
- Site_name: Full name of site (and any description)
- instrumentInfo: One entry for each instrument deployment involved in the dataset (the same instrument may be deployed several times in a period of months or years)
- StartDate: Start of deployment (or earliest part of request, whichever is latest)
- EndDate: End of deployment (or latest part of request, whichever is earliest)
- instSuffix: Instrument suffix (analogous to serial number, see above)
- Positions: One entry for each instrument involved in the deployment (can be multiple e.g. eddy covariance)
- instDescription: Human-readable instrument name
- easting: Instrument position [m east of site co-ordinates]
- northing: Instrument position [m north of site co-ordinates]
- height: Measurement height [m]:
- Most cases: Above sea level
- Indoor sensors: Above floor level
- Buried/submerged sensors: Below surface
- instSerial: Instrument serial number
- roll: Roll (directed sensors only; degrees clockwise around line of sight axis)
- pitch: Pitch angle (degrees; 180=up, 0=down, 90=horizontal)
- yaw: Direction that instrument is pointing in (degrees clockwise from north)
- pitch: Pitch angle (degrees; 180=up, 0=down, 90=horizontal)
- For indoor sensors only:
- roomType: Type of room (indoor sensors only)
- distanceToWindow: Distance [m] to nearest window (indoor sensors only)
- buildingStorey: Storey of building (indoor sensors only)
- For directed sensors only:
- targetHeight: height of target (m above sea level)
- targetSite: Site that measurement is directed at
- targetMaterial: Construction material of target
- targetFacet: Facet of target object
- For profile sensors only:
- profileStep: Step size [m] of regularly-spaced vertical profile from height to profileTop
- profileTop: Top of profile (e.g. scintillometers)
- sampleType: The sample type of the raw data (before processing): Either “instantaneous” or “average”
Definitions of sensor types
Directed sensors: Instruments such as cameras, infra-red thermometers or scintillometers that are pointed at a particular surface or site.
Profile sensors: Instruments that measure a profile such as ceilometers or profile systems.
Buried/submerged sensors: Sensors placed below a surface
Indoor sensors: Sensors within a building designed to monitor internal conditions